Market Update

Market Update

Friday, January 29, 2016

MARKETING CORNER

Facebook Professional Services: How Your Local Business Can Rank


  • January 28, 2016 - Social Media Examiner

    Do you have a local business page on Facebook?
    Want to reach more local customers?
    Facebook recently launched Professional Services, a directory that helps consumers find the best local businesses and services to fit their needs.
    In this article I’ll share how to use the Facebook Professional Services feature to boost visibility with local customers.

    What Is Facebook Professional Services?

    Facebook Professional Services is a directory inside Facebook for local businesses. The goal is to help customers find local businesses with the best Facebook reviews and ratings.
    Facebook expert Mari Smith doesn’t see it as making “… a huge dent in Yelp… at first.” But, she continues, “Over time, as more and more businesses become savvy with their Facebook marketing, and really promote their page activity, the Services Directory and Places could be more of a first choice for consumers.”
    Customers can use the search box to find businesses in the area based on keywordsspecific to the products or services they need. They can also browse the top local business categories.
    Within search results or specific category selections, customers see basic details about local businesses, such as their description, address, phone number and ratings.

    Get the step-by-step instructions HERE

MARKET NEWS

Weekly mortgage apps up, rates down

January 29, 2016 - CUNA.org

WASHINGTON (1/29/16)--Mortgage applications jumped 8.8% for the week ending Jan. 27, according to the Mortgage Bankers Association’s (MBA) weekly mortgage application survey.
Refinance applications rose 11% from the previous week, while purchase applications climbed 5%. Annually, purchase applications have climbed 22%.
While applications continue to rise, mortgage rates have slimmed down of late.
The average rate for the 30-year fixed-rate mortgage dropped to 4.02% from 4.06% during the week, its lowest level since October, according to the MBA. Similarly, the 30-year rate as tracked by Freddie Mac averaged 3.79%, down from last week’s level of 3.81%.
“The yield on the 10-year Treasury stabilized around 2% this week, and the 30-year mortgage rate dipped 2 basis points to 3.79%,” said Sean Becketti, Freddie Mac chief economist. “The recent market turmoil has given the Fed pause; as was universally expected, the Fed stood pat this week but kept its options open for a rate increase in March.”
The 15-year fixed-rate mortgage rate this week averaged 3.07%, down from 3.1% the prior week, according to Freddie Mac, while the five-year Treasury-indexed hybrid adjustable-rate mortgage rate averaged 2.9%, down from 2.91%.
“This week’s housing (data) confirms the momentum of home sales going into 2016,” Becketti added. “A hesitant Fed, sub-4% mortgage rates (at least for a little while longer), and strong housing fundamentals should generate a 3% increase in home sales this year.”

Friday, January 22, 2016

MARKET SURVEY 1/21/16


01/21/16
(most recent)
Average
Rate
Points
& Fees
Margin
 30-Year Fixed Rate3.81%0.6N/A
 15-Year Fixed Rate3.10%0.5N/A
 5/1-Year ARM2.91%0.52.74
01/14/16
(previous week) 
Average
Rate
Points
& Fees
Margin
 30-Year Fixed Rate3.92%0.6N/A
 15-Year Fixed Rate3.19%0.5N/A
 5/1-Year ARM3.01%0.42.75
“The Freddie Mac mortgage rate survey had difficulty keeping up with market events this week. The 30-year mortgage rate dropped 11 basis points to the lowest rate in three months. This drop reflected weak inflation -- 0.7 percent CPI inflation for all of 2015 -- and nonstop financial market turbulence that is driving investors to the safe haven of Treasuries. However, the survey was largely complete prior to Wednesday’s Treasury rally that drove the yield on the 10-year Treasury below 2 percent, down 29 basis points since the end of 2015.”
– Sean Becketti, chief economist, Freddie Mac
The data presented above are the exact published results of Freddie Mac’s Primary Mortgage Market Survey® (PMMS®) and are provided for informational purposes only. The data are not rate quotes and are not intended as an advertisement of interest rates as defined by Regulation Z, Section 1026.2.
The financial and other information contained herein speaks only as of the date posted herein. In general, the data presented were calculated from information collected Monday through Wednesday of the same week that the PMMS is released and may not reflect mortgage rates, fees or points currently available. Averages are for conforming mortgages with 20% down. Average fees and points are provided to reflect the total upfront cost of obtaining a mortgage (one point equals one percent of the loan amount). Freddie Mac, and/or the provider of this information, is/are not responsible for business decisions made based on the reported results of the PMMS.

*** Weekly Market Rate Survey as published by Freddie Mac. The above survey is not a direct quote of rate by Fairway Independent Mortgage and is intended solely for the purposes of reporting the published results of Freddie Mac's Primary Mortgage Market Survey®. Fairway Independent Mortgage is an Equal Opportunity Lender. FIMC NMLS ID 2289.

SOCIAL SHARE FOR YOUR WEEKEND

Copy/Paste below link onto your Facebook or LinkedIn. Keeping followers informed keeps you top of mind!

LINK TO SHARE:  http://www.realtor.com/advice/sell/sell-home-right-price/?cid=soc_20160121_57454056&adbid=10153951018052871&adbpl=fb&adbpr=35368227870

So You Wanna Sell Your Home? Step 3: List It at the Right Price


Angela Colley - Realtor.com
Putting a price tag on a home you’re trying to sell is a tricky thing. For one, it’s your home, crammed full of memories, hopes, and dreams—and all that stuff can cloud your thinking and lead you toward the wrong price. There are consequences: Shoot too high, and your home could languish on the market for months and maybe not sell at all. Price it too low and you could bilk yourself out of a whole lot of dough.
That’s why we’re here to guide you through this tough but critical decision (and all the others you’ll have to make) with our step-by-step weekly Home-Selling Guide. Read on to pinpoint a price that’s just right.
READ FULL ARTICLE HERE

MARKETING CORNER

Social Calendar: January 2016 Update of Best Times to Post to Social Media


January 6, 2016 // 8:00 AM 

The Best Times to Post on Facebook, Twitter, LinkedIn & Other Social Media Sites [Infographic]


best-times-social-media-posts.jpeg
Social media is one of the best ways to amplify the great content you’re creating. But it isn’t enough to just post content to social whenever you feel like it. Some times are better than others.
So … When’s the best time to post content to social media?
Unfortunately, there's no perfect answer. Different businesses may find different days and times work best for them. In fact, timing often depends on the platform you're using, how your target audience interacts with that platform, the region(s) you're targeting, the content of your post (e.g. funny or serious), and your goals (e.g. clicks versus shares).
That being said, there is ample data out there on optimal times to post on Facebook, Twitter, LinkedIn, Pinterest, and Instagram. In the infographic below, we've pulled together data and research collected by the folks at CoSchedule from a variety of sources, including QuickSproutSurePayrollThe Huffington Post, BufferTrackMavenFast Company, and KISSmetrics.
Think of this data as a general guideline, and use it to help you find the optimal posting times for your business.
VIEW POSTING TIMES HERE

MARKET NEWS

Rising Home Equity, Outstanding Mortgage Debt Indicate a Healthy Housing Market


"...factors indicate that the single-family housing segment is the strongest it has been post-crisis—but there is still room left for improvement..."

January 22, 2016 - Brian Honea, DSNews.com

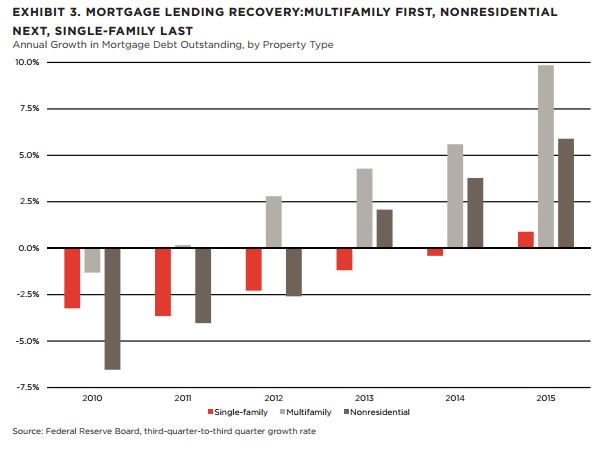
The number of homeowners in the United States with negative equity, or are “underwater,” is about one-third of what it was during its peak reached in 2010, and single-family mortgage debt outstanding is on the rise.
Combined, those two factors indicate that the single-family housing segment is the strongest it has been post-crisis—but there is still room left for improvement, according to CoreLogic’s January 2016 MarketPulse released on Thursday.
Not only are homeowners rapidly regaining equity (the number of underwater homeowners had fallen to 8 percent, or about 4.1 million, as of the end of September 2015), but equity in owner-occupied homes is gaining at a faster pace than average, according to CoreLogic. Equity in owner-occupied homes has risen by $1.3 trillion year-to-date in 2015 as of the end of September, compared to an increase of $741 billion for all single-family homes during the same period.
Single-family mortgage debt outstanding also rose in the first nine months of 2015, but only by $80 billion. In fact, 2015 was the first year in a decade that both home equity and mortgage debt outstanding rose during the same year. Single-family was the last of the major property segments to see an increase in mortgage debt outstanding following the crisis, after multifamily (2011) and non-residential (2013), according CoreLogic.

In a growing housing market, mortgage debt outstanding and home equity will continue to rise, CoreLogic Chief Economist Frank Nothaft said. According to Nothaft, Mortgage debt outstanding will increase during a growing market for three reasons:
  • More homebuyers using a mortgage loan to buy a home;
  • Existing homeowners cash out equity through a refinance or a second mortgage;
  • Aggregate debt outstanding and mortgage debt outstanding can increase simultaneously due to an increase in single-family housing stock.
“The growth in home equity and nascent recovery in single-family mortgage debt underscore that the single-family market continues to get healthier but has not fully recovered,” Nothaft said. “If home prices rise uniformly across the nation in the coming year, we expect to see the number of underwater homes fall by another 1.1 million in the coming year as appreciation lifts them up from being underwater. This will allow their equity to grow while their debt pays down.”

Friday, January 15, 2016

MARKET SURVEY 1/14/16

Weekly Mortgage Interest Rate Report
January 14, 2016
 Week ending on 01/14/16Average
Rate
Points
& Fees
Margin
 30-Year Fixed Rate3.92%0.6N/A
 15-Year Fixed Rate3.19%0.5N/A
 5/1-Year Adjustable Rate3.01%0.42.75
 1-Year Adjustable Rate2.68%0.22.74
 Week ending on 01/07/16Average
Rate
Points
& Fees
Margin
 30-Year Fixed Rate3.97%0.6N/A
 15-Year Fixed Rate3.26%0.5N/A
 5/1-Year Adjustable Rate3.09%0.52.75
 1-Year Adjustable Rate2.68%0.22.74
“Long-term Treasury yields continue to drop, dragging mortgage rates down with them. Turbulence in overseas financial markets is generating a flight-to-quality which benefits U.S. Treasury securities. In addition, sagging oil prices are capping inflation expectations. The net effect on the 30-year mortgage rate was a 5 basis point drop.”
– Sean Becketti, chief economist, Freddie Mac
Data and information is provided by Freddie Mac's Primary Mortgage Market Survey® (PMMS)
This is not intended as an advertisement of interest rates as defined by Regulation Z, Section 1026.2. Data is provided for informational purposes only. The financial and other information contained herein speaks only as of the date posted herein. Freddie Mac, and/or the sender of this information, is not responsible for business decisions made based on the reported results of the PMMS. In general, the data presented were calculated from information collected Monday through Wednesday of the same week that the PMMS is released and may not reflect mortgage rates, fees or points currently available. Average fees and points are provided to reflect the total upfront cost of obtaining a mortgage. Borrowers may still pay closing costs which are not included in the survey.